
Figure 5.
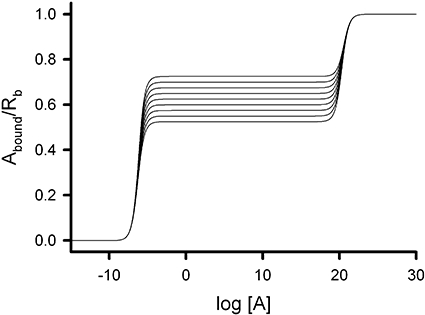
The dimer and tetramer model with independent oligomeric states. The graph shows the variation of the ligand bound per receptor site (Y = Abound/Rb) with the logarithm of ligand concentration (log[A]) for the fraction of the dimer state varying from 0.1 (upper intermediate asymptote) to 0.9 (lower intermediate asymptote) by 0.1. Fixed values used for the system parameters were K1 = 10−6, K2 = 1020, K3 = 10−6, K4 = 10−6, K5 = 10−6 and K6 = 1020. Intermediate plateaus are found between 0.525 (90% dimer + 10% tetramer) and 0.725 (10% dimer + 90% tetramer).