Figure 5.

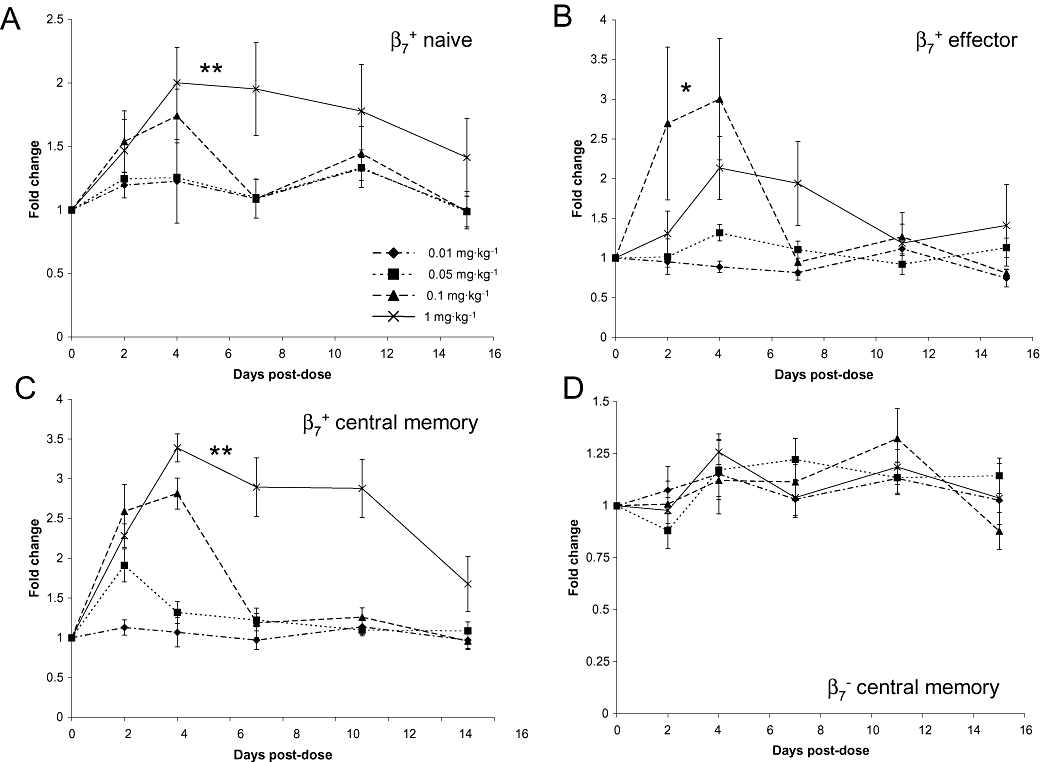
Fold change in β7+ populations of T-cells following increasing intravenous doses of PF-00547659 over pre-dose baseline levels in the cynomolgus macaque. (A) Mean fold change in the population of β7+ naive T-cells following escalating intravenous doses of PF-00547659 (0.01–1 mg·kg−1) was determined by a change in the absolute cell number over the pre-dose levels. Data are plotted as means ± SEM (n = 4); **P = 0.007 and 0.009 for 0.01 and 0.05 mg·kg−1 groups respectively; (B) Mean fold change in the population of β7+ effector memory T-cells following escalating intravenous doses of PF-00547659 (0.01–1 mg·kg−1). Data are plotted as means ± SEM (n = 4); *, p < 0.05 over the 0.01 mg/kg group; (C) Mean fold change in the population of β7+ central memory T-cells following escalating intravenous doses of PF-00547659 (0.01–1 mg·kg−1), as determined by a change in the absolute cell number over the pre-dose levels. Data are plotted as means ± SEM (n = 4); **, p = 0.002 and 0.008 for 0.01 and 0.05 mg·kg−1 groups respectively; (D) Mean fold change in the population of β7− central memory T-cells following escalating intravenous doses of PF-00547659 (0.01–1 mg·kg−1). Data are plotted as means ± SEM (n = 4).
