
Figure 7.
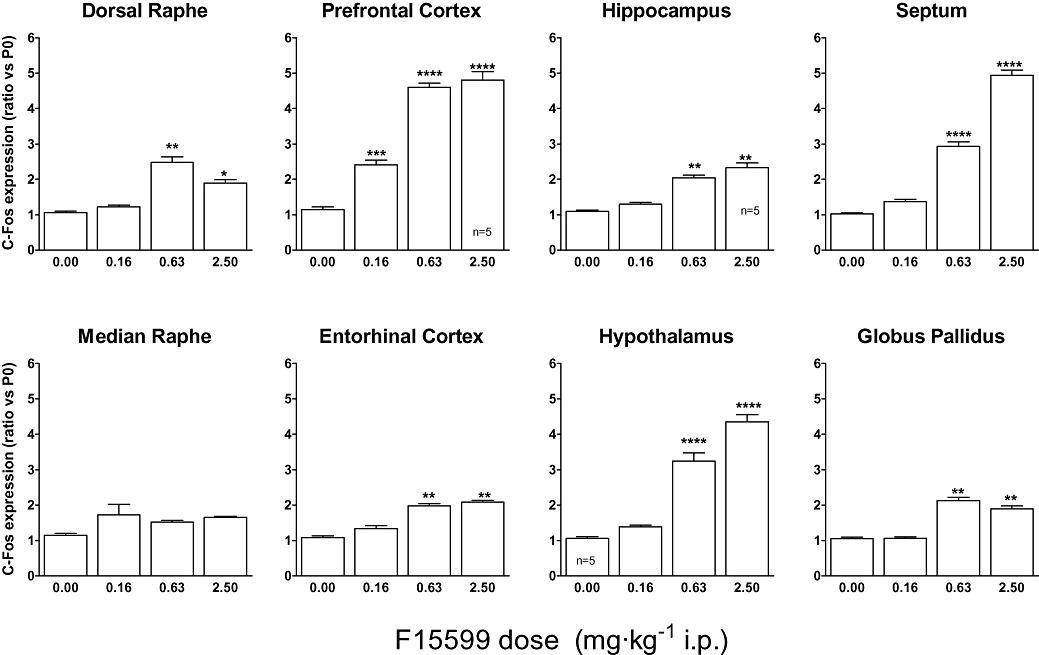
Influence of F15599 on c-fos mRNA induction by F15599 in different rat brain regions. The mean value of the control group (saline-treated animals) was set at 1 (basal value) using Arbp (i.e. P0) as the reference gene for normalization. All data were expressed as fold induction relative to basal value. Except where indicated otherwise, bars represent the mean ± SEM of values from six animals. anova with Tukey's test was used to evaluate differences in c-fos expression between treatment groups. The significance level is fixed at 5%.