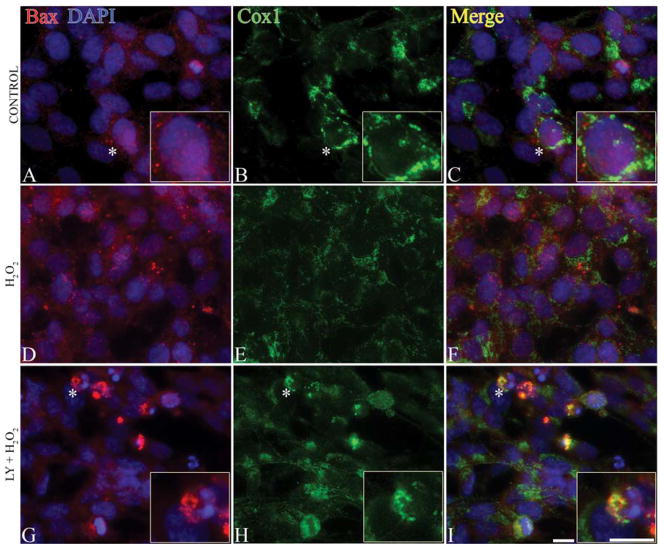
Fig. 4.
Bax translocation to the mitochondria following PI3K inhibition. (A–C) Control SH-SY5Y cells; (D–F) cells treated with 0.1 mM H2O2 for 24 h; (G–I) cells pre-treated with PI3K inhibitor (20 μM of LY294002, LY) and then treated with 0.1 mM H2O2 for 24 h (LY + H2O2). Cells were double immunostained with Bax (N-20, red), Cox1 (green) and nuclei were visualized by DAPI (blue). Asterisks indicate cells in inserts. Normal healthy control cells are shown in A and C. In H2O2 only treatments (D–F), cells are healthy with intact nuclei and diffuse Bax staining in the cytoplasm. PI3K inhibition resulted in punctate Bax staining (G) and Bax translocation to mitochondria (H) as is evident by yellow signal in the merged image (I). Bars = 10 μm.

