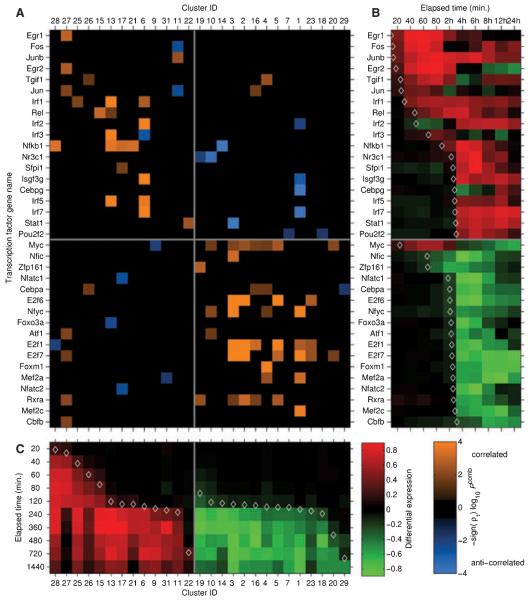
Fig. 5. Hypothesis-generating transcriptional regulatory network controlling the macrophage response to TLR activation.
The computational analyses used to generate this predicted regulatory network are described in the main text. (A) Matrix defining potential interactions between transcription factors (TFs) and clusters of co-expressed genes. Each column represents a cluster of co-expressed genes, while each row represents a TF potentially controlling gene expression in the network. Clusters and TFs are ordered according to the kinetics of their responses to LPS stimulation. An orange solid rectangle indicates that the TF is potentially an activator for the genes in the cluster, while a blue solid rectangle indicates that the TFis potentially a repressor for the genes in the cluster. (B) Heat-map depicting gene expression profiles for TFs in the network in response to LPS stimulation. Red indicates upregulation, while green indicates downregulation. (C) Heat-map depicting median expression profile of genes in each co-regulated cluster in response to LPS stimulation. Red indicates upregulation, while green indicates downregulation (figure reproduced from 98).

