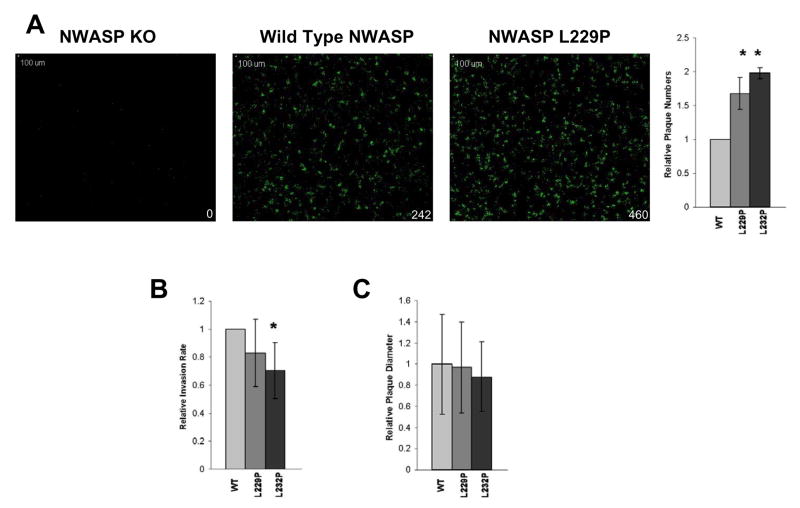
Fig. 3. Markedly increased plaque numbers, but not invasion rate or intercellular spread, in cells expressing constitutively active NWASP.
(A) Increased number of plaques formed in cell lines expressing constitutively active NWASP L229 and L2332. Representative monolayers imaged 48h after infection with GFP expressing Shigella. Green signal represents Shigella plaques (inset indicates number of plaques in monolayer). Histogram on right is quantification of three independent experiments. (B) Shigella invasion rates are compared in stable cell lines expressing WT, L229 or L2332 NWASP constructs. Results shown are average of three independent experiments (* p < 0.05). (C) The average size of plaques formed in each cell line expressing mutant NWASP constructs was not significantly different from cell lines expressing WT NWASP. Combined results of three individual experiments are shown.

