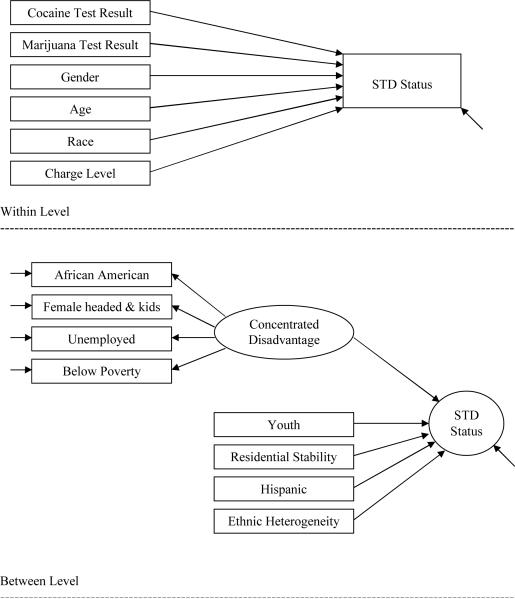
Figure 1. Two-Level STD Logistic Regression Analysis.
Notes. Data were derived from 2000 U.S. Census tract information. Concentrated disadvantage = factor of four socio-economic indicators including proportion of unemployed population, proportion African-American population, proportion below poverty, and proportion of female-headed households with children. Youth = proportion of residents less than 18 years old. Divorced = proportion of divorced population 15 years or older. Residential stability = proportion living in same house since 1995. Ethnic heterogeneity = one minus the sum of the proportion of each race/ethnicity. Hispanic = proportion of Hispanic residents.

