
Figure 1. ABHD5-shRNA reduced protein levels of ABHD5 by 90%.
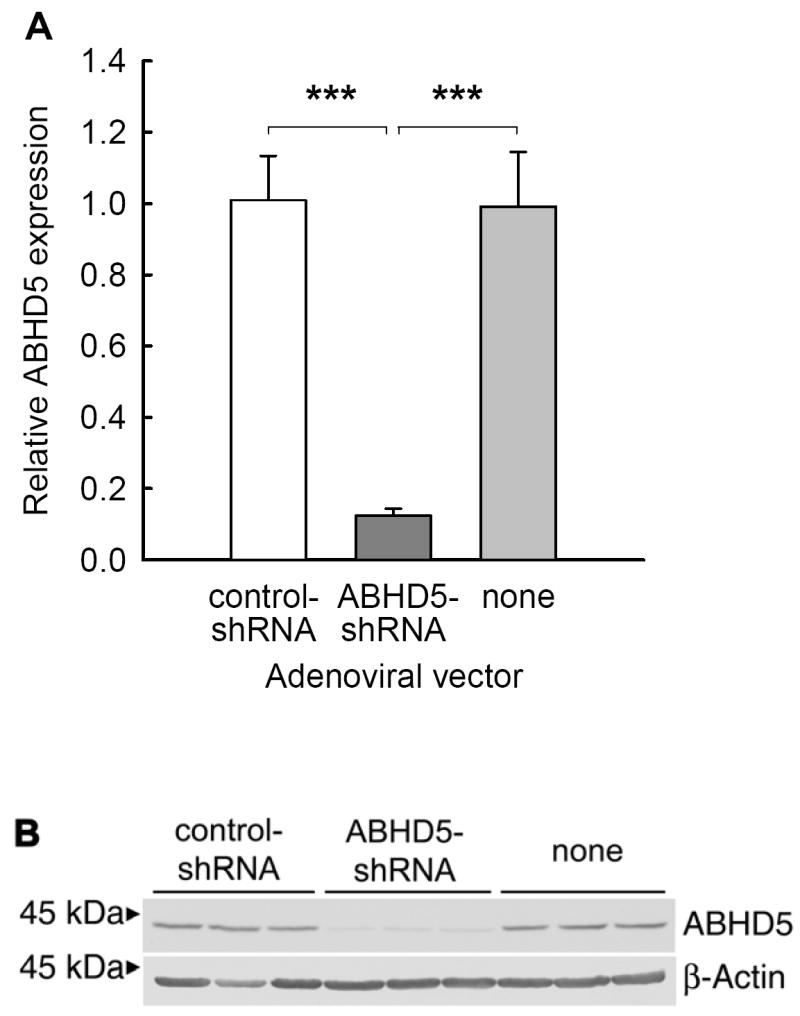
McA RH7777 cells were transduced with either ABHD5-shRNA or control-shRNA, or were not transduced. Cells were harvested after 48 hours of growth in serum-containing culture medium without supplemental fatty acids. The expression of ABHD5 and β-actin were analyzed by immunoblotting (B). Expression of ABHD5 was quantified by scanning densitometry and expressed relative to controls (A). The results represent the means and standard deviations from a representative experiment with triplicate samples. The experiment was repeated five times with similar results. Statistical analysis was performed using one-way ANOVA and Bonferroni’s post-hoc test; *** indicates significant differences at p < 0.001.