
Figure 4.
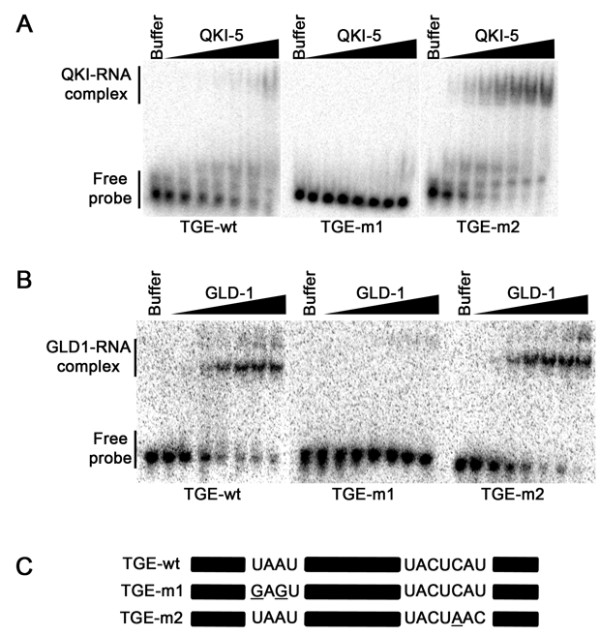
GLD-1 binding to the tra2/gli element analysis. (A) RNA species tested in (B) and (C) are shown. The black bars denote sequences that are unaltered between the wild-type and the mutant versions. EMSAs of the tra2/Gli element with increasing concentrations of GLD-1 (B) and QKI (C) (by a factor of 2 from 2 nM) or with buffer alone. Migration patterns of unbound RNAs (free probe) and protein/bound RNAs (GLD-1/RNA or QKI/RNA complexes) are indicated on the left.