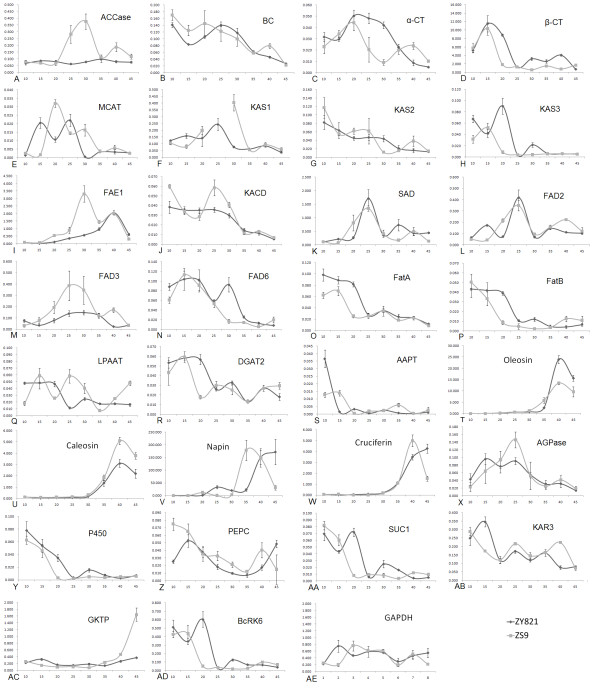
Figure 2.
The expression profile of fatty acid synthesis genes during seed development. (A-D) ACCase gene family. (E-J) Genes involved in fatty acid elongation. (K-N) Desaturase. (O-P) Thioesterase. (Q-S) Genes involved in TAG synthesis. (T-W) Oil body proteins. (X-AE) Other basic metabolism genes. Abbreviated names for the genes are defined in Table 4. Values in parentheses indicate the relative copy number and Values in abscissa indicate the seed development stage. The black curves represent ZY821 and the gray curves represent ZS9. Each data point represents the mean ± SD of three replicates.

