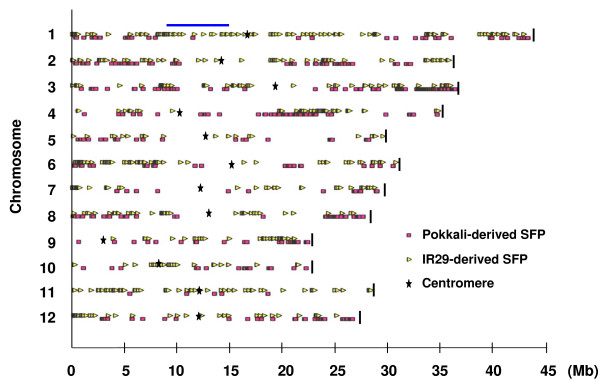
Figure 1.
Rice pseudomolecule map showing positions of SFPs detected in this study. SFPs in FL478 detected as Pokkali or IR29 haplotype by RPP method are shown in squares (pink) and triangles (yellow), respectively. Stars and vertical bars indicate the positions of the centromeres and the ends of chromosomes, respectively. Horizontal bar (blue) means the Saltol region.

