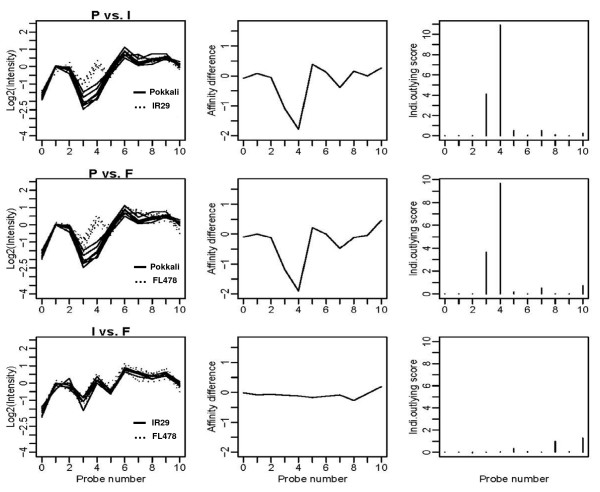
Figure 2.
SFP detection in a probe set by RPP method. (Left panel) Plots of the log intensities (PM, perfect match) for the representative probe set (Os.33510.1.S2_at) from three genotypes. (Middle panel) Plots of the differentiations of average log intensities among three genotypes. (Right panel) Plots of individual outlying scores. P, Pokkali; I, IR29; F, FL478. After Cui et al. (2005) [2].

