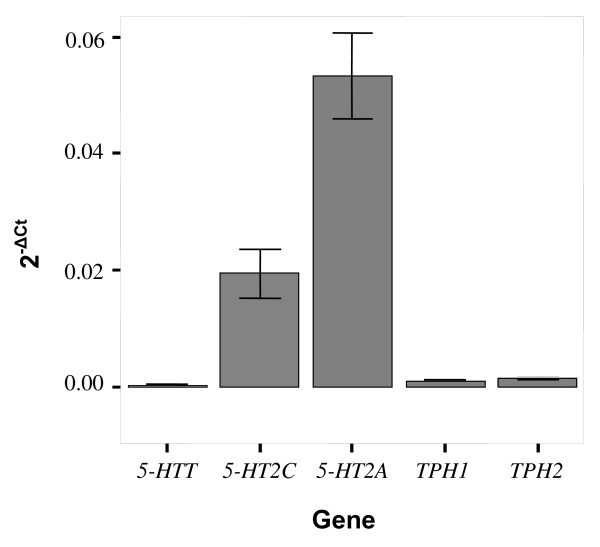
Figure 1.
Bar graph representing the expression (2-ΔCt) of five serotonergic genes before controlling for brain region, genotype or gender. All genes are expressed in the brain, 5-HTT showing the lowest expression and 5-HT2A the highest. Bars represent mean and error bars represent standard error of the mean (s.e.m).

