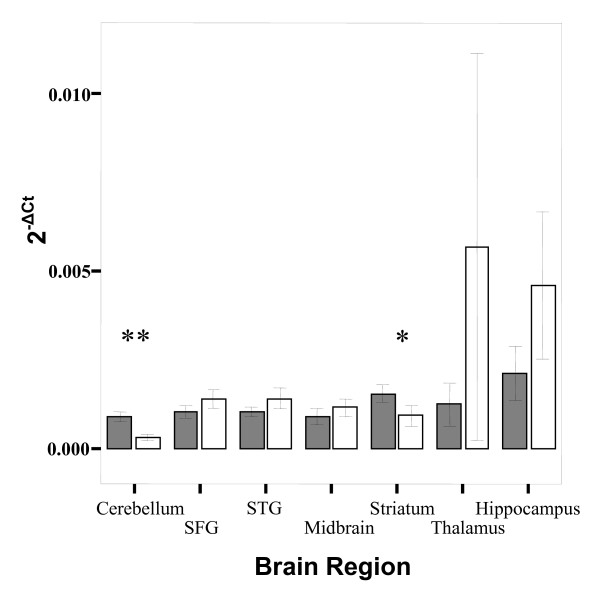
Figure 6.
Bar graph of mean expression (2-ΔCt) of TPH1 (grey bars) versus TPH2 (white bars) and error bars representing s.e.m. Both genes are expressed in all brain regions, and TPH1 expression is significantly higher than TPH2 in both the striatum (t = 2.487, p = 0.022, denoted by *) and cerebellum (t = 4.297, p < 0.001, denoted by **). The groups representing TPH2 expression in the hippocampus and thalamus have a much larger variance than that of TPH1, probably due to the smaller number of individuals in these groups (hippocampus N = 5, thalamus N = 2).

