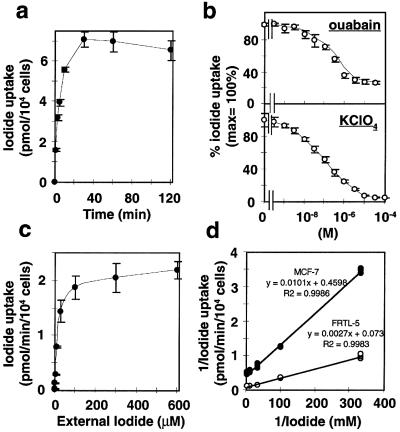
Figure 5.
Characterization of iodide uptake by tRA-treated MCF-7 cells. Cells were treated with 1 μM of tRA for 48 h before assay. (a) Time course of iodide uptake in tRA-treated MCF-7 cells. Iodide uptake was initiated by incubating MCF-7 cells with 500 μl of HBSS containing ≈0.1 μCi Na125I and 10 μM NaI. The reactions were terminated at the indicated times, and the content of iodide in the cells was determined. Values are means ± SD (n = 3). (b) Inhibition of RA-induced iodide uptake by ouabain and KClO4. (Upper) Indicated concentration of ouabain was added to the growth medium containing RA 30 min before the assay. In iodide uptake assay, cells were incubated for 30 min at 37°C with 500 μl of HBSS containing ≈0.1 μCi Na125I, 10 μM NaI, and the various concentrations of ouabain. (Lower) Inhibition of RA-induced iodide uptake by KClO4. Iodide uptake assay was performed by 30-min incubation with ≈0.1 μCi Na125I, 10 μM NaI, and indicated concentration of KClO4. (c and d) Dependency of initial velocity of iodide uptake (5 min) on the extracellular iodide concentration in tRA-treated MCF-7 cells (c), and comparison of the kinetics of iodide uptake between MCF-7 cells and FRTL-5 rat thyroid cells (d). Cells were incubated at 37°C for 5 min with 500 μl of HBSS containing 20 mCi/mmol 125I- and indicated concentration of NaI. Trapped 125I- was measured by γ-counter and normalized to the cell number. Nonspecific binding of 125I- was determined in duplicate assays in the presence of 30 μM KClO4, and this value was normalized to the cell number and subtracted from the values measured (36). (c) The subtracted data (net uptake velocity) are expressed as means ± SD (n = 3). (d) The data of 3–300 μM NaI, which were chosen according to previous studies (33, 36, 41), are graphed as Lineweaver-Burk plot. All points of triplicate wells are plotted. ●, MCF-7 cells; ○, FRTL-5 cells.

