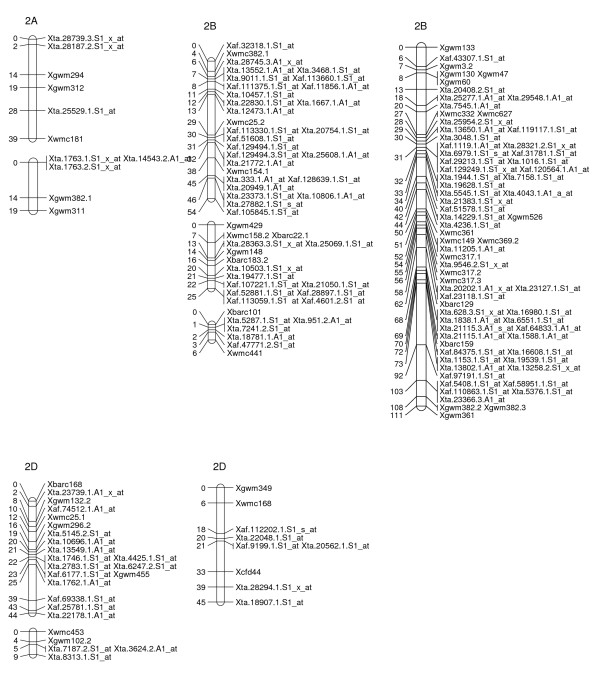
Figure 3.
A high-density map of wheat chromosome 2 consisting of 164 SFP and SSR markers in Ning 7840/Clark population. Numbers to the left of each chromosome are interval distances in centimorgans. On the right of each chromosome are mapped markers; markers derived from the Affymetrix 'Ta.' probe sets were abbreviated as 'Xta' and those from 'TaAffx' as 'Xaf'.

