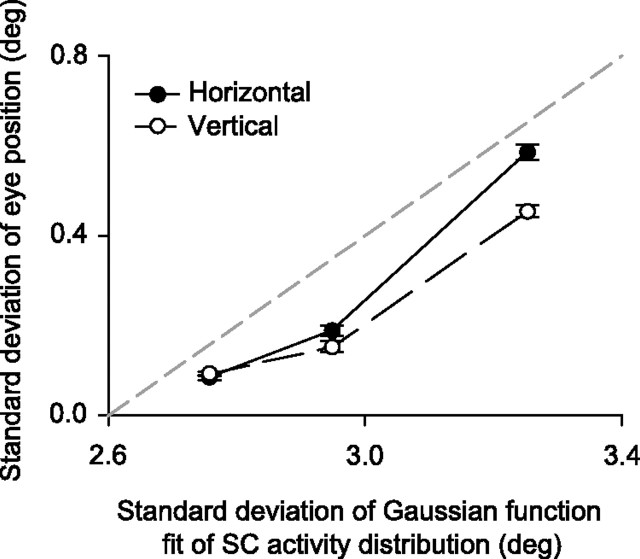
Figure 10.
Behavioral correlate of the changes in the spatial extent of SC activity representing goal location. We computed the SDs of horizontal and vertical eye position relative to the tracked goal (i.e., the two-dimensional spatial precision of eye movements) and plotted them against the SD of the Gaussian function fits of SC activity shown in Figure 9. When a larger population of SC neurons was recruited to represent the behavioral goal, there was also a greater variability of two-dimensional eye position around this goal. Error bars denote 95% confidence intervals (across sessions), and the dashed gray line is the line of unity slope. Each data point on the x-axis (in increasing order) corresponds to the extrafoveal stimulation, foveal tracking, and extrafoveal tracking conditions, respectively.

