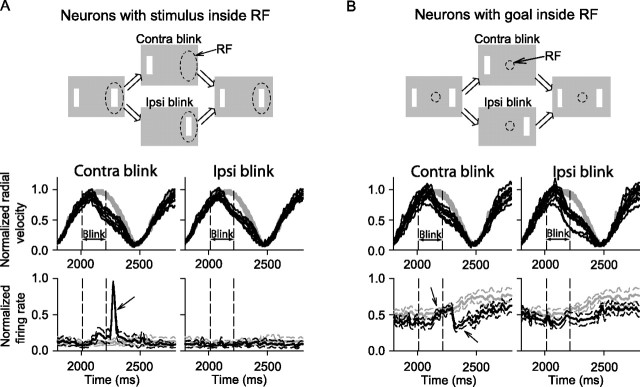
Figure 12.
Activity of SC neurons during the extrafoveal tracking blink condition. A, For nine neurons with peripheral preferred eccentricities, we recorded activity while one of the bars was transiently blanked for 200 ms (top schematic). The bar that was blanked was either the one inside the response field of the neuron (contra blink, dashed oval in schematic) or the one outside it (ipsi blink). The top row of data show the average normalized eye velocity traces for the nine neurons in the baseline extrafoveal tracking condition (gray) and in the blink condition (black). Each trace is the average for one neuron, with normalization done based on the gray curves. Eye velocity was reduced by bar blanking, but it did so similarly regardless of which bar was removed (compare contra and ipsi blink plots). The second row of data plots the average normalized spike density curves across neurons (with SEM envelopes) when the contra and ipsi bars were blanked (black curves). The gray curves show the average responses of the same neurons when no bars were blanked. When the contra bar was blanked, a visual burst occurred shortly after the bar reappeared (arrow). B, The same analyses were made for 10 neurons representing the invisible goal location. These neurons maintained their activity during the blank interval, regardless of which bar was removed (compare black and gray neuronal responses; arrow during blink). When the contra bar was removed, the neurons also exhibited a short-lived reduction after the peripheral bar reappeared (arrow after blink). RF, Response field.

