
Figure 2.
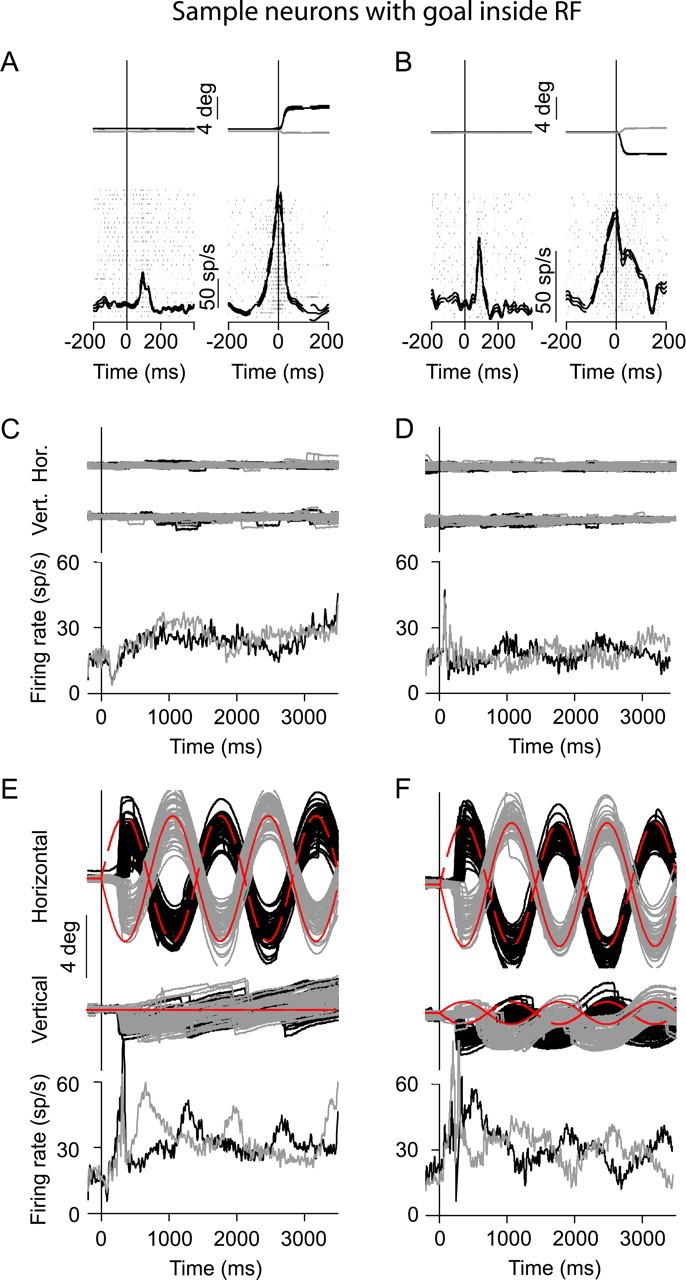
Sample neurons having the inferred goal of extrafoveal tracking inside their response fields (RF). A–F, Each column plots the responses of one neuron during memory-guided saccades (A, B), extrafoveal stimulation (C, D), and extrafoveal tracking (E, F). A, B, The left traces of each column show eye position (black for horizontal and gray for vertical) and neuronal responses (rasters and spike density) aligned on target onset. The right traces in each column show these same variables aligned on saccade onset. These two neurons exhibited saccade-related activity for small saccades and also exhibited fixation-related activity (data not shown). The thin dashed lines indicate SEM. C, D, Each column plots eye position (top two rows) and average spike density functions in the extrafoveal stimulation condition for each neuron individually. The black and gray traces show responses for the rightward and leftward starting phases of stimulus motion, respectively. The neurons were active, but there was no strong modulation in their activity level as a function of time or stimulus phase. E, F, Same as C and D, but for extrafoveal tracking. The neurons were more active (on average) during extrafoveal tracking than during extrafoveal stimulation, and their activity level was clearly modulated as a function of time. Red indicates veridical goal trajectory in each phase. For all horizontal and vertical eye positions, upward deflections indicate rightward and upward, respectively. Also, the eye position scale bars in E and F apply for the curves of C and D as well.