
Figure 4.
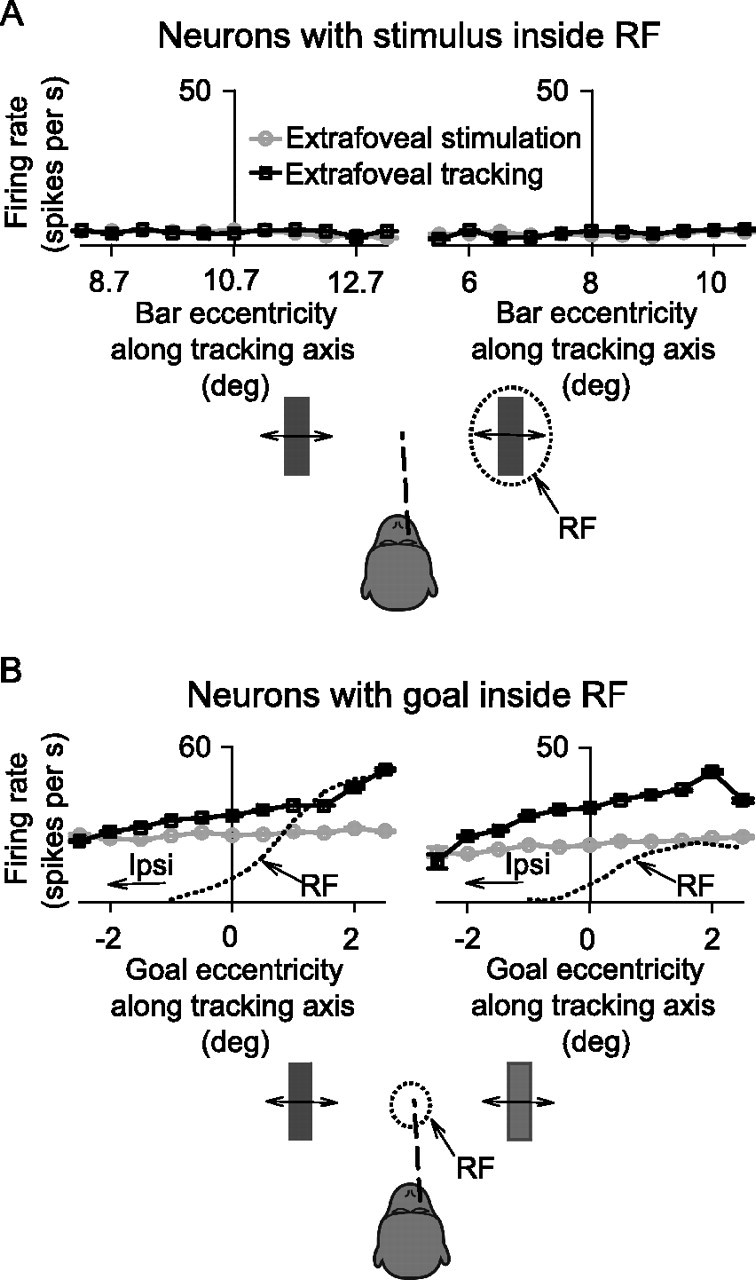
Spatial tuning of the sample neurons of Figures 2 and 3 for stimulus or goal location. A, For the neurons in Figure 3, we recalculated responses during sustained extrafoveal tracking (black curves) and extrafoveal stimulation (gray curves) as a function of the retinal eccentricity of the contralateral bar along the tracking axis. The results of each neuron (left and right) demonstrate that the bar inside the response field (RF) did not recruit much more activity when it was being used to guide extrafoveal tracking than when it was passively viewed. B, The same analysis, but for the neurons of Figure 2, and now showing responses as a function of the location of the invisible midpoint between the two bars. 0° on the x-axis indicates the vertical meridian. During extrafoveal tracking (solid black curves), each neuron increased its responses when the goal occupied retinal locations approaching the center of the contralateral RF (estimated with the dotted line from visually guided saccade data), and decreased it otherwise. During extrafoveal stimulation (gray curves), there was no apparent change in the responses of the same neurons with changes in the (ignored) midpoint location. Error bars denote SEM.