
Figure 7.
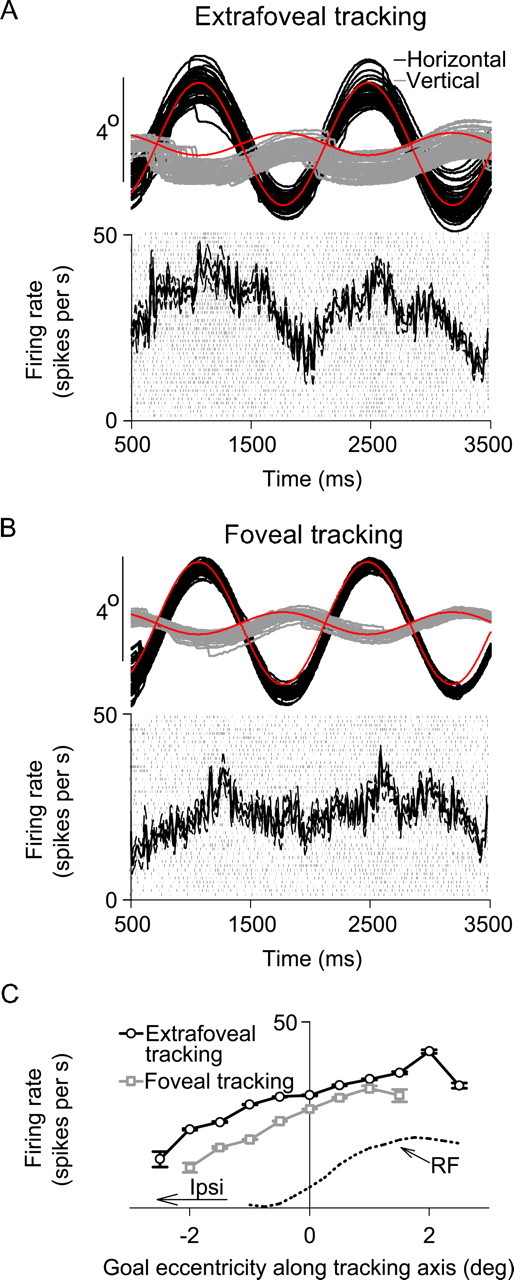
Similarities and differences between extrafoveal tracking and foveal tracking. A, Sample eye position traces and neuronal responses during extrafoveal tracking from the same neuron of Figure 2, B, D, and F. Neuronal responses are now shown as average spike densities (with SEM envelopes) and as raw spike rasters. B, Responses of the same neuron when the midpoint between the two bars was shown explicitly with a small spot. The neuron was still modulated, but to a lesser extent. C, These observations were also made when we measured responses as a function of retinotopic goal location along the tracking axis. In both conditions, the neuron exhibited similar preference for goal location, regardless of whether the goal was visible or not. The curve for foveal tracking has fewer sampled positions on the x-axis because of the higher spatial precision of tracking in this condition. The red curves in A and B indicate veridical goal location, and the dotted black curve in C indicates our estimate of the response field (RF) profile of the neuron at the displayed locations.