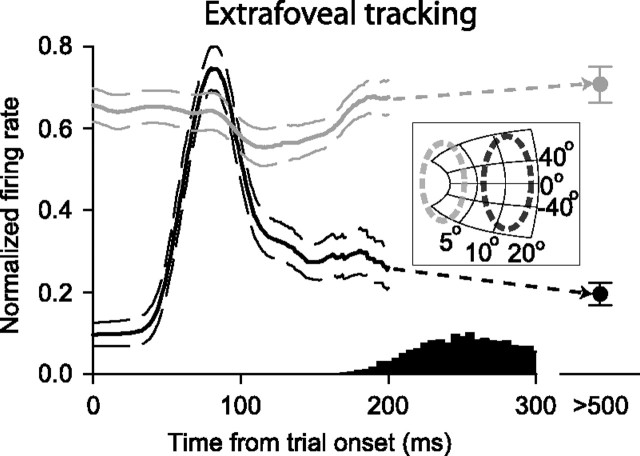
Figure 8.
Spatial locus of SC activity immediately after trial onset in the extrafoveal tracking condition. We plotted average spike density functions for the first 200 ms of extrafoveal tracking trials (i.e., before tracking had started). Neurons with peripheral response fields and having one of the bars inside these fields often exhibited a transient burst of activity after bar onset (black curves). Neurons with more central response fields had relatively high levels of activity at trial onset (during maintained fixation of a small spot), and these neurons exhibited a transient reduction in their activity shortly after bar onset (gray curves). The histogram on the bottom shows first saccade latencies (to initiate tracking), and the data point labeled “>500” shows the average activity during sustained extrafoveal tracking (after any initiation saccades had completed). The inset shows the approximate recorded locations on the SC map of the two groups of neurons described in this figure. The thin curves and error bars denote SEM.

