
Figure 9.
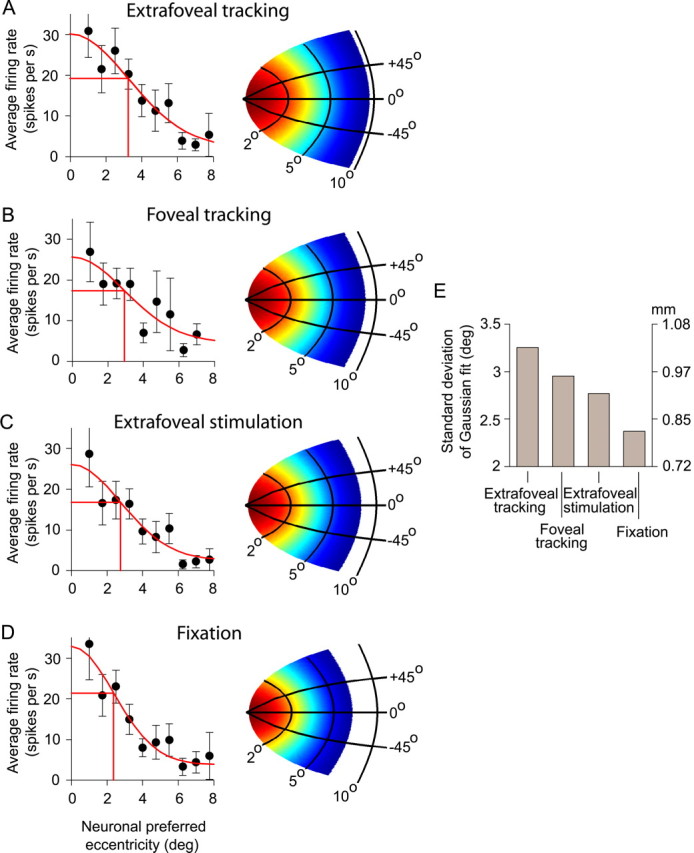
Spatial distribution of SC activity during sustained extrafoveal tracking, foveal tracking, extrafoveal stimulation, and fixation. A, In the extrafoveal tracking condition, we binned all neurons according to their preferred eccentricity and then plotted the average firing rate in each eccentricity bin when the inferred movement goal was aligned with the center of gaze. The activity was centered on the fovea and could be described with a Gaussian function fit. The map on the right of the panel shows the putative distribution of SC activity based on this Gaussian fit, if circular symmetry is assumed (red is maximal activity; blue is minimal activity). B, Similar observations were made for the foveal tracking condition, except that the spatial extent of activity was smaller, suggesting a smaller population of active neurons in this condition (compare putative SC map to that in A). C, Extrafoveal stimulation had an even narrow distribution of SC activity. D, The smallest population of recruited SC neurons that we could estimate was that during fixation of a small spot with no other peripheral stimuli. The size of the activity distribution estimated in this condition was similar to that obtained previously [Munoz and Wurtz (1995b), their Figs. 7H, 12] with a similar behavior. E, Summary of the SD of the Gaussian function fits for all four conditions shown in A–D. This SD is shown in degrees of visual angle (left y-axis) and in millimeters of SC coordinates according to the mathematical model of Equation 1 (right y-axis).