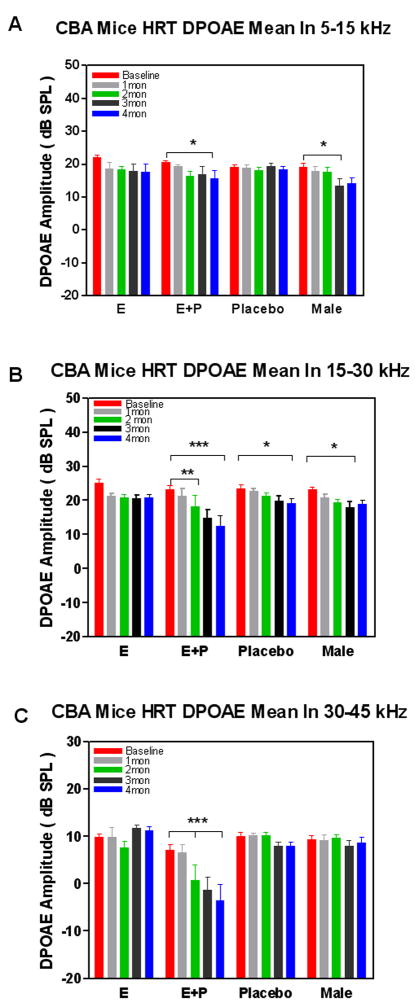
Figure 3.
Longitudinal comparisons of otoacoustic emissions amplitudes among groups revealed statistically significant changes across: A) low (5–15 kHz), B) middle (15–30 kHz) and C) high (30–45 kHz) frequency ranges for the E+P treatment group at 4 mon of treatment, and as early as 2 mon in the middle and high frequency ranges. Less significant changes were seen within the middle frequency range at 4 mon for the placebo and male groups. Error bars represent standard error of the mean (SEM).

