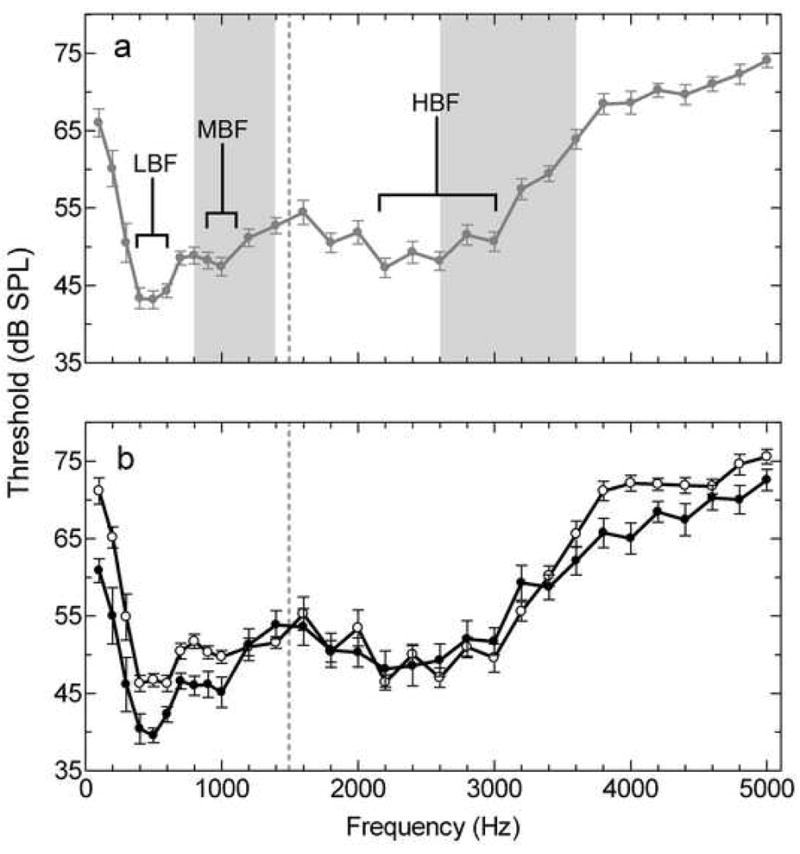
Figure 1.

Mean multiunit audiograms from Hyla cinerea. (a) Male and female audiograms combined. Each filled circle represents the mean threshold in response to the corresponding pure tone (n=14). Brackets denote the three peaks in sensitivity and the grey vertical bars denote the spectral bands of the male advertisement call. This audiogram is consistent with multiunit and behavioral audiograms previously published for this species (Lombard and Straughan, 1974; Penna et al., 1992, Megela-Simmons et al., 1985). (b) Males (filled circles, n=7) and females (open circles, n=7) represented in separate audiograms. The vertical dashed line in (a) and (b) represents the division between the AP and BP range of frequencies. Error bars represent SEM.
