
FIG. 3.
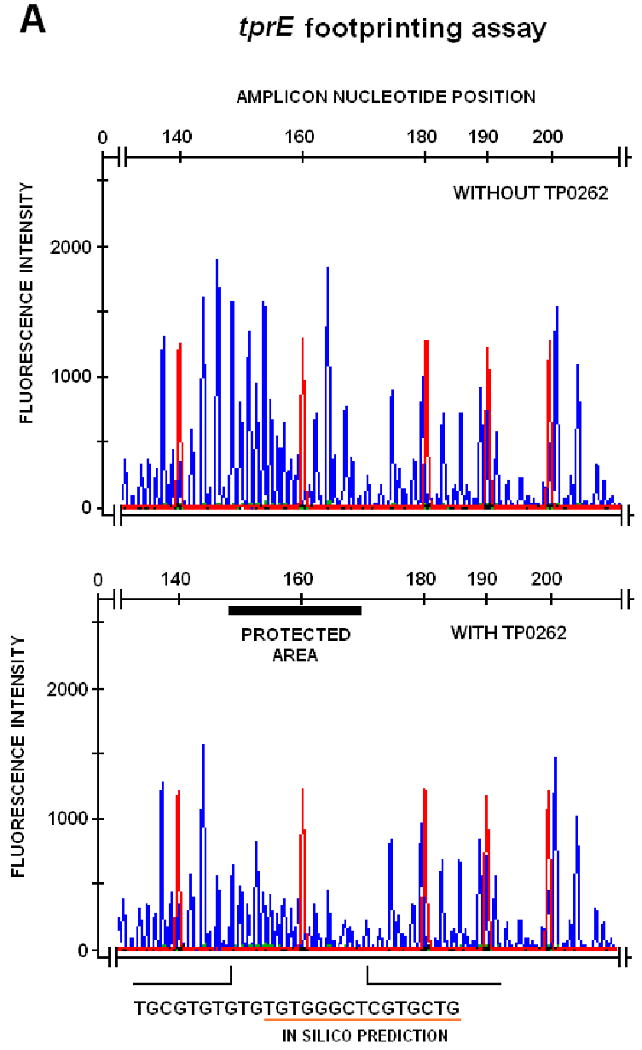
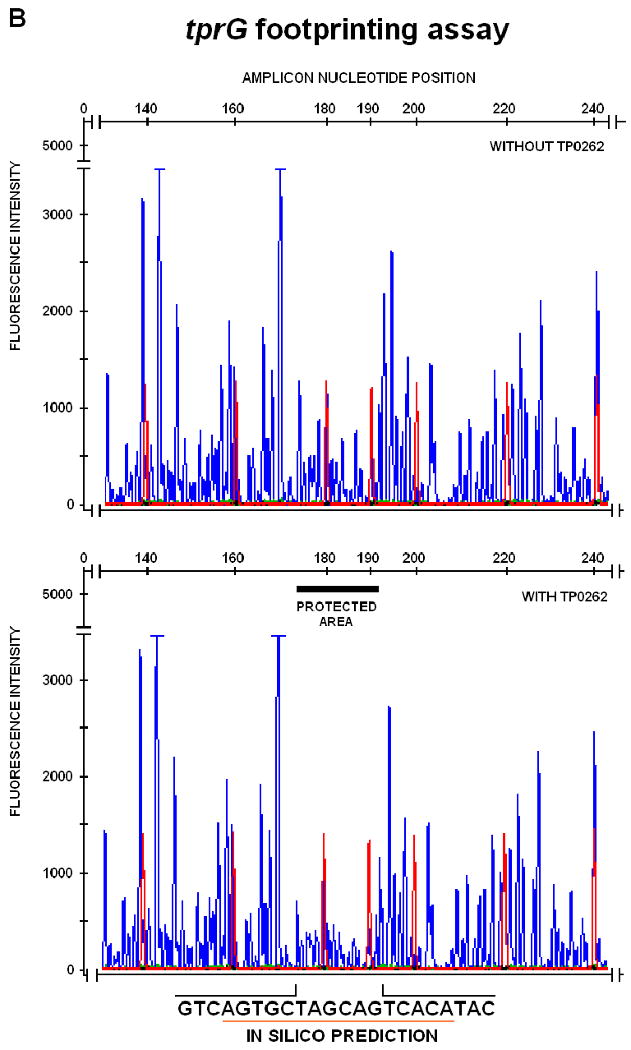

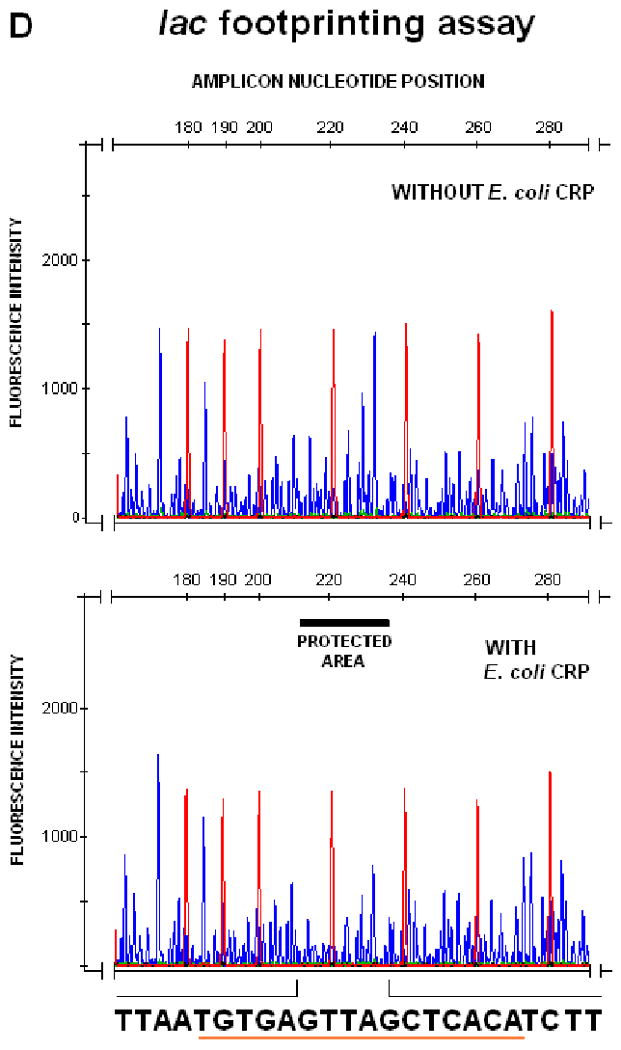
DNAseI footprinting assay on tprE (Panel A), tprG (Panel B), and tprJ (Panel C) promoters. Fluorescence intensity and peak size were evaluated using the GeneMapper 3.5 software. Signal from samples digested in presence or absence of recombinant TP0262 or E. coli CRP were statistically compared using the paired Student's t-test with significance set at p<0.05. Red peaks indicate the ROX-labeled DNA ladder, blue peaks represent fragments generated by DNaseI digestion. Sequences of the protected areas are represented at the bottom of each figure; underlined sequences represent the TP0262 binding site originally predicted in silico. In the positive control, the GTGTA-6N-TCACT sequence in the E. coli lac promoter was shown to be protected by recombinant E. coli CRP as expected (Panel D).