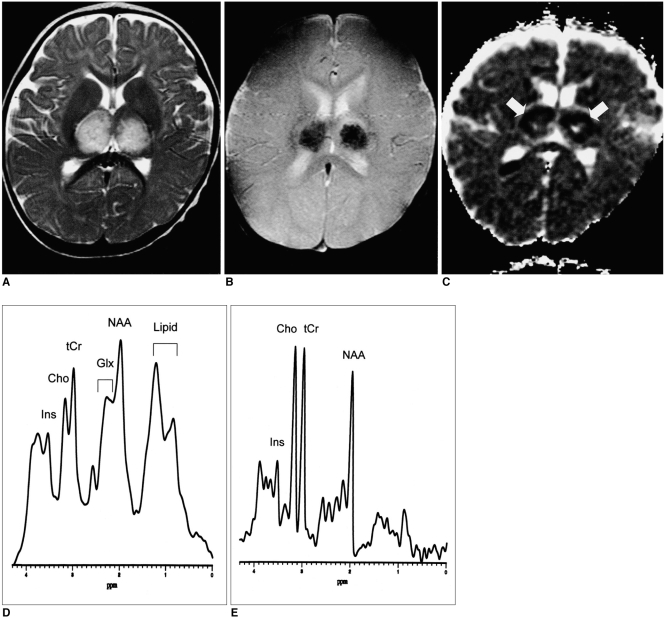
Fig. 1.
A 10-month-old boy with sequelae of severe motor deficit.
A. Axial fast spin-echo T2-weighted MR image (TR/TE=3500/120) shows symmetric high signal intensity in the bilateral thalami.
B. Axial T2*-weighted gradient-echo MR image (TR/TE=800/30, flip angle = 20°) at the same level as A shows conspicuous low signal intensity within the thalamic lesions, possibly due to the presence there of acute petechial hemorrhage.
C. Apparent diffusion coefficient (ADC) map of diffusion imaging reveals low ADC in the thalamic lesions (arrows), which may represent the presence of cytotoxic edema. In the central portion of the lesions, however, ADC is high, suggesting tissue necrosis.
D. Short echo-time proton MR spectrogram (STEAM 3000/30) of a thalamic lesion shows increased glutamate/glutamine complex peak intensities at 2.0-2.5 ppm and lipid/lactate complex peak intensities at 0.8-1.5 ppm, as compared with an age-matched control subject (E). Broadening of the line-width may be caused by the occurrence of petechial hemorrhage within the lesion.
E. Short echo-time proton MR spectrogram (STEAM 3000/30) of normal thalamus in a 9-month-old age-matched control subject.
Note.-Ins=myoinositol, Cho=choline compound, tCr=creatine complex, Glx=glutamate/glutamine complex, NAA=N-acetyl aspartate

