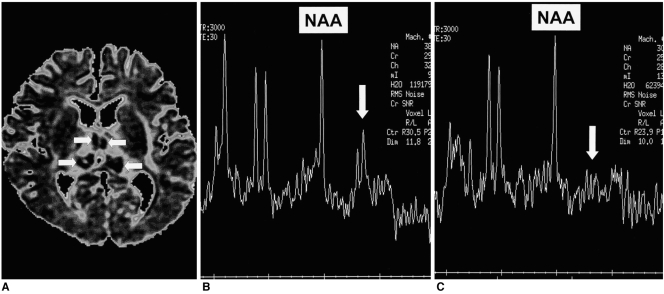
Fig. 2.
A 6-month-old girl without significant neurologic sequelae.
A. ADC map of diffusion imaging shows that the thalamic lesions have a concentric appearance. They have high-signal centers with low-signal rims (arrows), and the ADC values of their remaining portion are high.
B. Initial proton MR spectrogram (STEAM 3000/30) of a lesion shows a small lactate peak (arrow). The N-acetyl aspartate peak is within the normal range.
C. Follow-up proton MR spectrogram (STEAM 3000/30) obtained one week later shows no lactate peak (arrow). The N-acetyl aspartate peak shows no interval change and is still within the normal range.
Note.-NAA=N-acetyl aspartate

