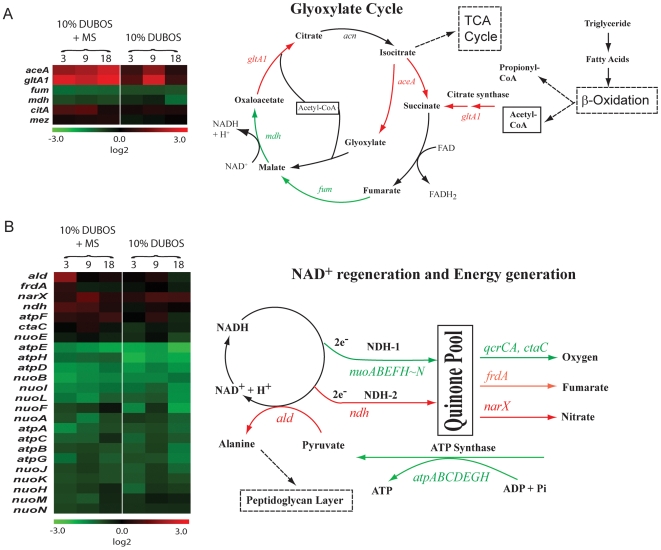
Figure 7. Microarray analysis demonstrated changes in expression of genes involved in glyoxylate cycle and energy metabolism.
(A), The expression ratio of genes involved in glyoxylate shunt cycle was shown in the red-green-display according to the log2-tranformed color code. Experimental time-points were shown at the top of the column. Genes were selected based on their annotation in TubercuList database, and grouped into those that were either regulated at least one of the time-points under multiple- stress condition. (B), Energy generation and NAD regeneration under multiple-stress. Genes involved in energy generation were selected based on their annotation. Red denotes induction and green denotes repression.

