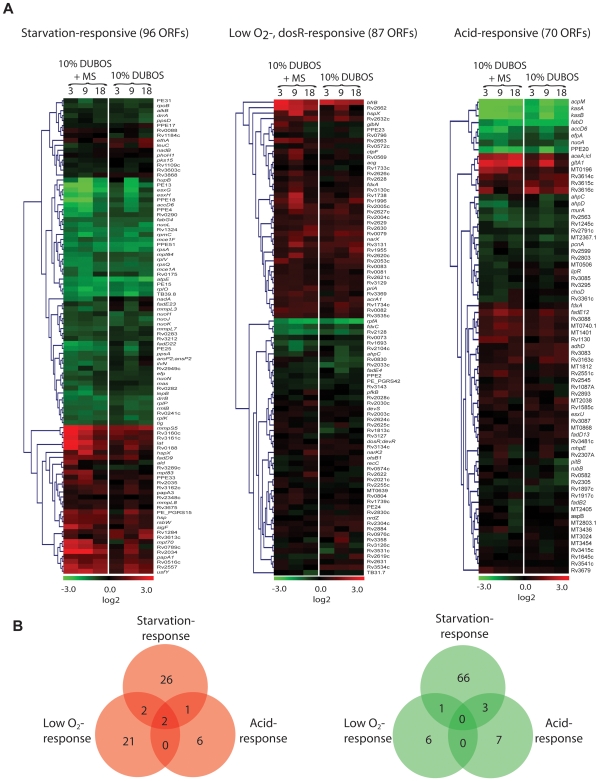
Figure 8. Functional clustering of Mtb genes under multiple-stress revealed nutrient starvation made major contribution to the number of genes that show changes in expression.
(A), Microarray data of Mtb gene expression under multiple-stress compared to the respective expression data for selected genes reported for nutrient-starvation- [21], hypoxic- [39], [66], and low pH-response [22]. Expression ratios were averaged, log2-transformed, and displayed according to the color code at the bottom of the each column. Experimental time-points were indicated at the top of the each column. The Euclidean average linkage clustering (standard z-transformed) was performed to generate gene trees shown at the left side of each column. MS, Multiple-stress. (B), Venn diagrams showing the number of overlapping and unique set of genes modulated more than 1.8-fold at any time-points under multiple-stress condition. Induced or repressed genes were selected to categorize based on stress-response in red circle or green circle to indicate gene induction or repression, respectively.

