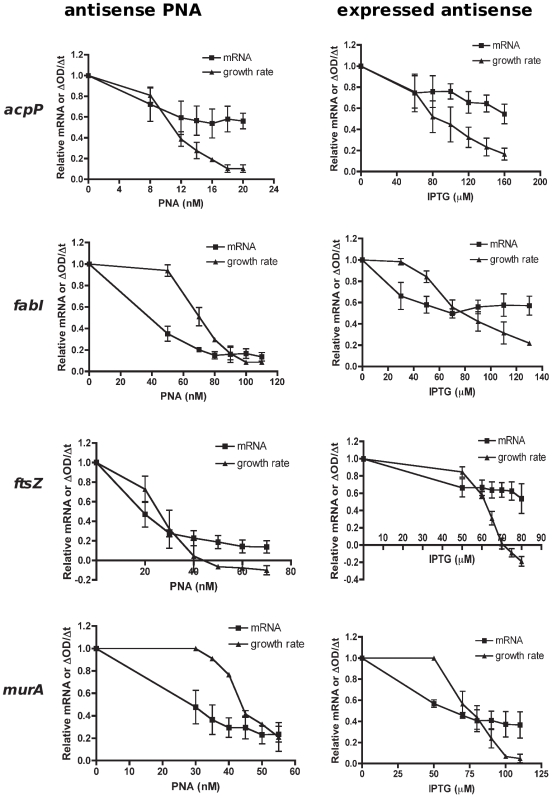
Figure 3. Gene silencing in E. coli to obtain a titration of declining growth rates and transcript levels by antisense PNA and expressed antisense.
E. coli AS19 was treated with PNA doses, while TOP10 clones containing antisense-expressing plasmids were induced with various IPTG concentrations as shown in Figure 2, so as to obtain growth inhibition in a dose-dependent manner. Total RNA from E. coli cultures was harvested at the time when the control culture increased in OD550 by 0.1. RNA was used for cDNA synthesis and quantitative real-time PCR to determine mRNA levels by normalization to a reference gene rpoA, and then calculated relative to the unsilenced (untreated) control. Growth rates were determined by OD550 readings over time. The relationship between mRNA and growth rate decline indicated growth requirement stringency of each gene.

