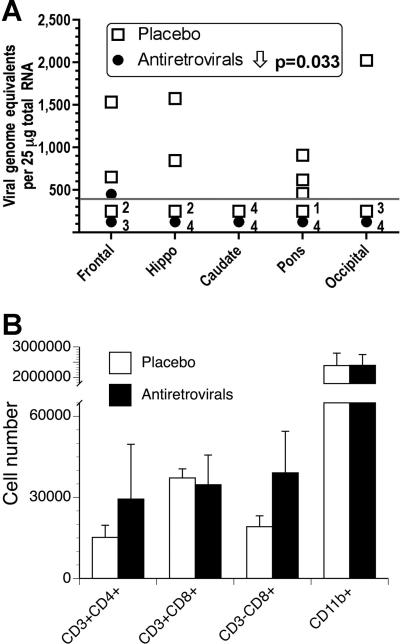
Figure 2.
Viral and immune parameters in the brain. (A) Brain viral load in the indicated regions of the brain. The limit of detection of the assay is indicated by the dotted line; the number of samples from each group that were below that limit is indicated. Two-way ANOVA revealed a significant effect of treatment. (B) Distribution of cell subpopulations in the brain parenchyma of the two groups of SIV-infected monkeys. There were no significant differences between the groups.

