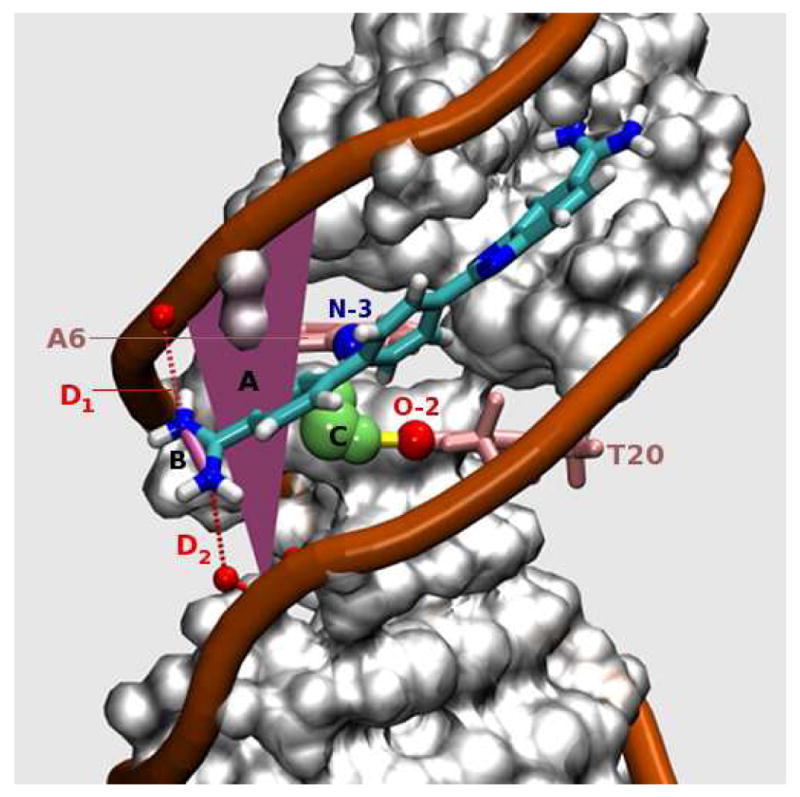
Figure 3.

DB921-DNA complex in the parallel conformation (‖). The angle from the line, labeled B, (connecting N-N of the phenylamidine) to reference plane, labeled A, is close to 0° (+/- 20°), and thus the figure represents one of the parallel conformations (‖) observed in the MD simulation. The yellow cylindrical lines represent H-bonds. Legends: (A) Plane of reference constructed to computationally classify each frame (20 ps snapshot) into ‖ or ⊥ modes of interaction. The plane is approximately parallel to the floor of the DNA minor groove (see text for details). (B) Line used to calculate the angle made by the amidine group to the reference plane (and hence, approximately to the floor of the groove). This angle is calculated for each snapshot of the MD and is used as an index to classify the frame into its respective binding mode. (C) Long residence time water observed consistently in the simulation. The persistent DNA H-bonding partners for this water are A6-N3 (labeled in blue) and T20-O2 (labeled in red). (D) The phosphate-amidine electrostatic interactions are denoted by D1 and D2 (red dotted lines).
