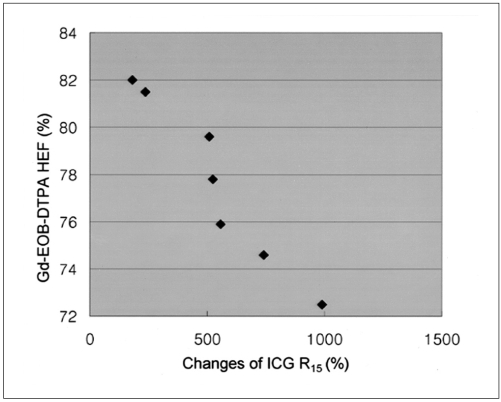
Fig. 4.
Scattergram shows the relationship between the Gd-EOB-DTPA hepatic extraction fraction and the changes of indocyanine green R15 before and after hepatic injury. The Gd-EOB-DTPA hepatic extraction fraction decreased as the indocyanine green R15 values increased (correlation coefficient = -0.965, p = 0.000, Pearson correlation coefficient assessment).

