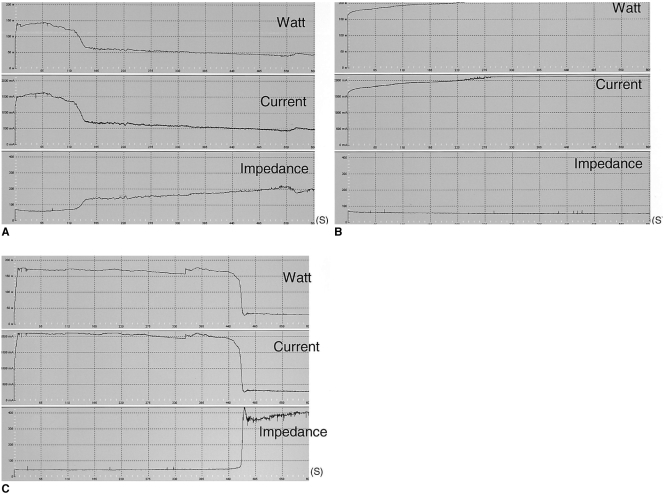
Fig. 3.
Graphic depiction of the changes occurring in tissue impedance, current, and power during radiofrequency ablation. Note that tissue impedance increased markedly and the current decreased during radiofrequency energy instillation in the dry radiofrequency mode. The upper row indicates radiofrequency power (watt), the middle row indicates current (mA) and the lower row indicates impedance (ohm). The horizontal axis indicates ablation time (second).
A. Standard dry radiofrequency ablation (group A).
B. Wet radiofrequency ablation with 5% NaCl infusion (group C).
C. Radiofrequency ablation with 36% NaCl preinjection (group D).

