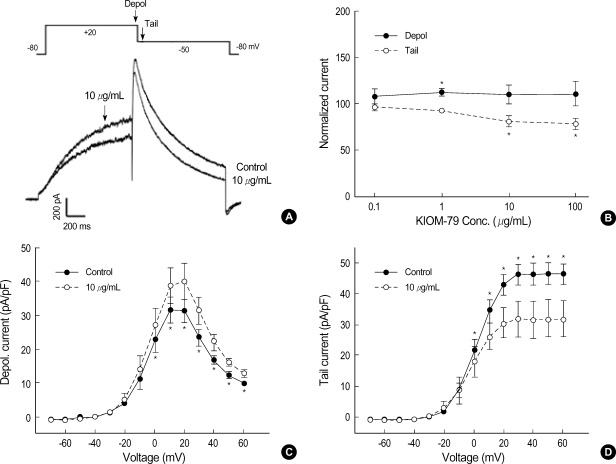
Fig. 4.
Effects of KIOM-79 on hERG current. (A) Representative hERG current traces recorded from HEK293 cells before and after application of 10 µg/mL KIOM-79. The currents were recorded with a test depolarization from the holding potential of -80 to +20 mV (1 sec), with tail currents recorded upon repolarization to -50 mV for 1 sec. (B) Dose dependent relationship for the increase of Idepol (•) and the decrease of Itail (○) by KIOM-79 (µg/mL): 0.1 (n=3), 1 (n=8), 10 (n=10), 100 (n=5). Each symbol represents mean±SEM of current amplitudes normalized to control currents (%). The amplitudes of Idepol and Itail were measured at the timing indicated by downward arrows in the pulse protocol of panel (A). (C, D) I-V curves for Idepol and Itail before and after application of 10 µg/mL KIOM-79. Each symbol represents mean±SEM of current amplitudes normalized to the cell capacitance (pA/pF, n=6). *P value <0.05 vs. control.

