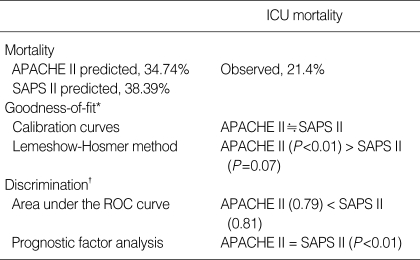
Table 4.
Comparison of the scoring systems performances to predict ICU and hospital mortality
*Using calibration curves, the ability to provide a risk estimate corresponding to observed mortality was assessed between two systems and it showed equal result. Using Lemeshow-Hosmer method, χ2 statistics was calculated to test the goodness of fit of the model between the contingency tables and it provided a very significant p-value for the APACHE II scoring system (P<0.01) but not for SAPS II (P=0.07). †Using AUC, the ability to discriminate between patients who survived and patients who did not was assessed. Comparison of the AUC revealed a slightly better fit in favor of SAPS II (area, 0.81 vs. 0.79 for APACHE II).
ICU, intensive care unit; APACHE II, Acute physiology and chronic health evaluation II; SAPS II, simplified acute physiology score II; ROC, receiver operating characteristic curve.

