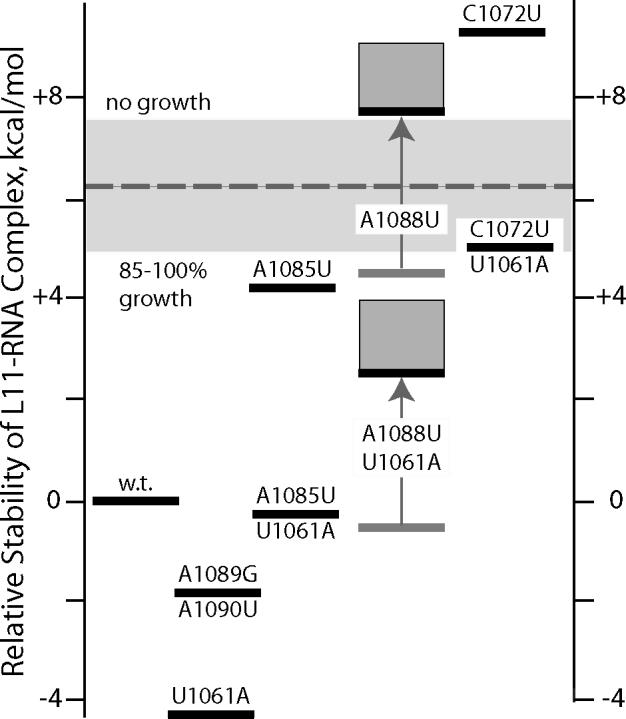
Figure 4.

Energy level diagram for rRNA domains and L11-rRNA complexes for all the rRNA variants studied. The relative free energy plotted on the ordinate is ΔΔG°tot = ΔΔG°F + ΔΔG°L11 where the free energies are reported relative to ΔG°tot for wild type rRNA (equation 4, Materials and Methods). ΔΔG°F is taken from Table 1. It is assumed that L11 stabilizes all the rRNA variants by the same amount as wild type (ΔΔG°L11 = 0), with the exception of RNAs containing the A1088U variant; weaker binding of these RNAs is indicated by the gray arrows (shaded boxes indicate uncertainty in the amount of destabilization; see text). The dashed horizontal line divides the variants into two groups, based on the growth rates of cells expressing rRNA with the mutations; the same line represents a hypothetical mutant whose growth rate is 50% of wild type and has 50% of ribosomes with an unfolded L11BD. The wide gray bar is the stability range over which growth rate and the extent to which the L11BD is folded are predicted to vary from 90% (lower edge) to 10% of wild type.
