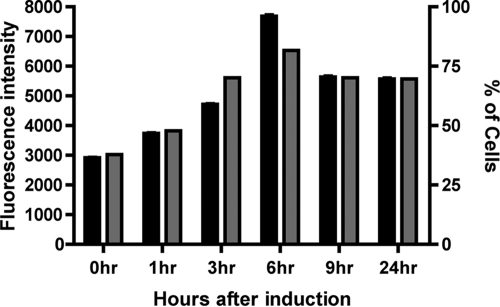
FIG. 3.
FACS analysis of the GFP signal intensity in RNR-CT-GFP cells after exposure to UV light. Both the percentage of cells with GFP signal above background (gray bars) and the mean fluorescence intensity of the population (black bars) increases over the first 6 hours after promoter induction. Each bar represents measurement of 10,000 cells at the time point listed on the x axis. The error bars represent the standard errors of the means.

