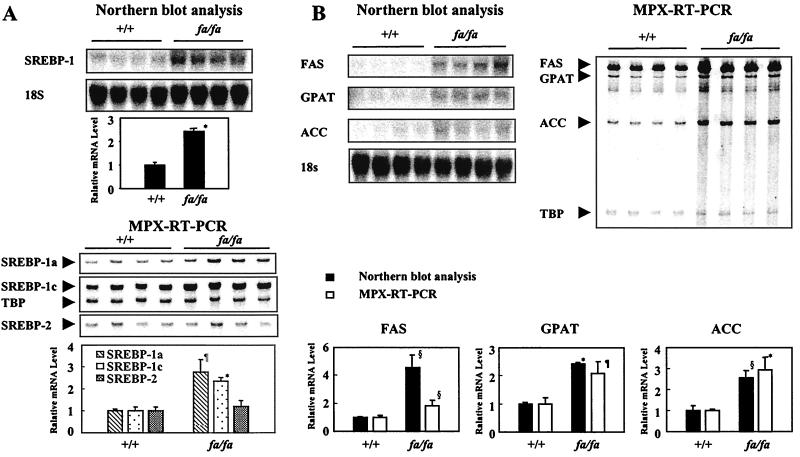
Figure 2.
mRNA expression profiles of SREBP family and lipogenic enzymes in liver. (A) Comparison of hepatic expression of SREBP-1, measured by Northern blotting (Upper), and that of SREBP-1a (▧), -1c (⊡), and SREBP-2 (░⃞), measured by RT-PCR in livers of lean (+/+) and fatty (fa/fa) ZDF rats. (B) Validation of MPX-RT-PCR (□) by comparison of mRNA expression profile of lipogenic enzyme expression with Northern blot analysis (■) in livers of lean (+/+) and obese (fa/fa) rats. Both techniques demonstrate higher expression of FAS, GPAT, and ACC in the obese group. Data were normalized in Northern blots by 18S ribosomal RNA and by TBP for RT-PCR. (*, P < 0.0005; ¶, P < 0.005; §, P < 0.05 lean +/+ vs. obese fa/fa.)

