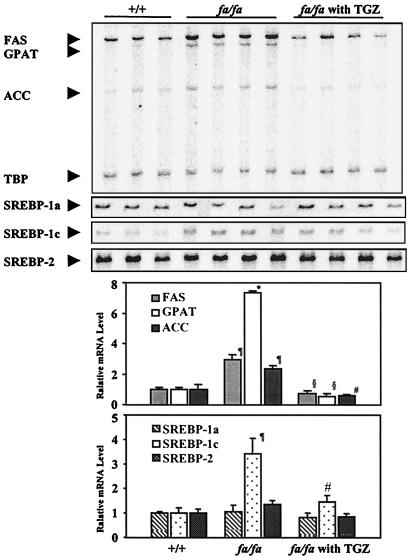
Figure 3.
Comparison of mRNA expression profiles of lipogenic enzymes [FAS (░⃞), GPAT (□), ACC (░⃞), and SREBP-1a (▧), SREBP-1c (⊡), and SREBP-2 (░⃞)] in islets of lean (+/+) ZDF rats, untreated obese, prediabetic (fa/fa) ZDF rats, or obese, prediabetic (fa/fa) ZDF rats treated with TGZ. (*, P < 0.0005; ¶, P < 0.05 lean +/+ vs. obese fa/fa; §, P < 0.005; #, P < 0.05 obese fa/fa vs. obese fa/fa with TGZ.)

