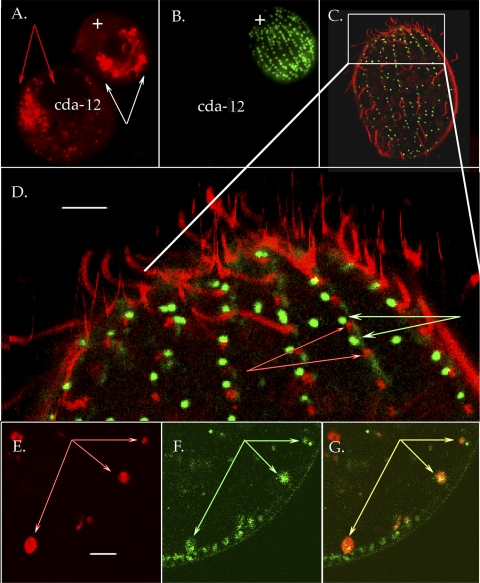
FIG. 4.
Endosomes in wild-type and cda12 mutant cell lines. (A and B) Pair of Tetrahymena cells, a cda12 mutant (left) and a wild-type cell (+) viewed with conventional fluorescence microscopy. Cells can be distinguished by MitoTracker (green) labeling of the wild-type cell in panel B. Cells were exposed to FM 4-64 for 25 min to load pinosomes and compartments downstream in the endocytic pathway. After 25 min, the cda12 mutant showed persistent, tiny vesicles (indicated by red arrows in panel A) while in the wild-type cell FM 4-64 had moved into larger vacuoles (indicated by white arrows in panel A). (C to G) Confocal images of live cells labeled with GFP-Cda12p (green) and FM 4-64 (red). (C) Whole cell imaged at the level of the cell cortex within minutes of FM 4-64 probe addition. Red pinosomes are clearly distinct from green Cda12p vesicles. (D) Magnified view of the cortical region boxed in panel C. Again, Cda12p (indicated by green-and-white arrows) does not overlap with the early pinosome population (indicated by red-and-white arrows). Scale bar, 3.0 μm. (E to G) Confocal optical section of GFP-Cda12p-labeled cells exposed to FM 4-64 for a longer period than the cell in panels C and D. (E) Red areas show FM 4-64 primarily in larger vacuoles (arrows). Scale bar, 2.0 μm. (F) Same field of view showing GFP-Cda12p. Small vesicles remain docked at the cortex, while larger vacuoles (arrows) reside in a deeper cortical location. (G) Double exposure shows colocalization of GFP-Cda12p and late-stage FM 4-64 probe in larger, more interior vacuoles (arrows).

