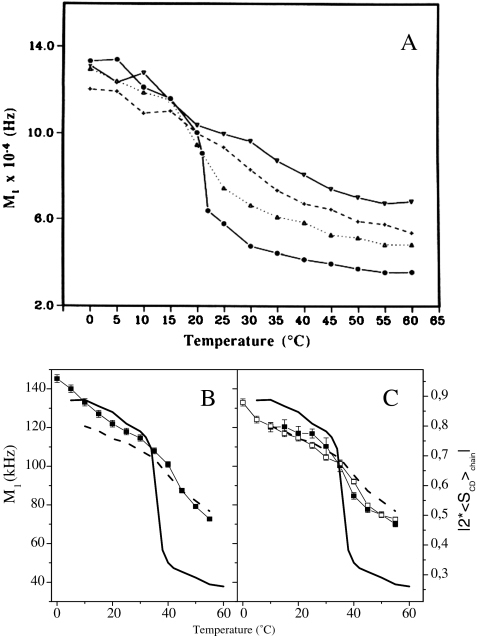
Fig. 6.
a Temperature variation of the first moment (proportional to chain order parameter), M1, of 2H-labeled DMPC spectra in the presence of various amounts of cycloartenol: pure lipid (filled circles), 10% (filled triangles), 20% (crosses), 30% (inverted filled triangles). Lower panel—first moments of 2H-NMR DPPC spectra with plant/fungi sterols versus temperature. First moments of pure DPPC-2H62 spectra (line without symbols) and of DPPC-2H62/CHO (30 mol%) spectra (dashed line without symbols) are shown in all diagrams for comparison. b DPPC-2H62 plus 30 mol% ERG (squares); c DPPC-2H62/STI (30 mol%; filled squares); DPPC-2H/SIT (30 mol%; empty squares). On double y-axis is plotted twice the chain order parameter. Adapted from [23] and [6]

