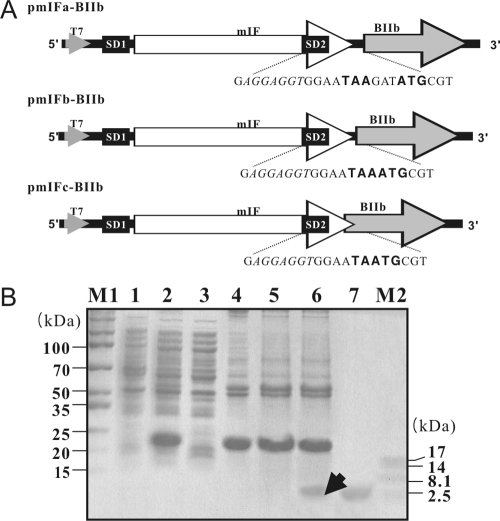
FIG. 1.
Schematic representation of the translationally coupled two-cistron systems and their products. (A) Schematic representation of the translationally coupled two cistrons encoding mIF and BIIb. The mIF and BIIb genes are represented as white and gray arrows, respectively. The two-cistron expression plasmids have two SD sequences: one (SD1) upstream of the 5′ end and the other (SD2) at the 3′ end of the first cistron. The stop codon (TAA) and start codon (ATG) are indicated in boldface, and the SD sequences are shown in italics. The T7 promoter is from bacteriophage T7. (B) SDS-PAGE analysis of the products of several two-cistron expression systems. Lanes 1 and 2 show total cell protein fractions before and after IPTG induction, respectively. IPTG (0.5 mM) was added when the OD600 of the E. coli culture reached 0.6. Lane 3 represents the soluble fraction obtained from the total cell protein fraction shown in lane 2. Lanes 4, 5, and 6 represent proteins from solubilized inclusion bodies (in 3 M urea, pH 10) expressed by pmIFa-BIIb, pmIFb-BIIb, and pmIFc-BIIb, respectively. Lane 7 indicates synthetic BIIb. The arrow indicates recombinant BIIb. Lanes M1 and M2 show molecular size markers, with the actual molecular sizes (in kDa) given by the numbers that flank the gel photograph.

