FIG. 3.
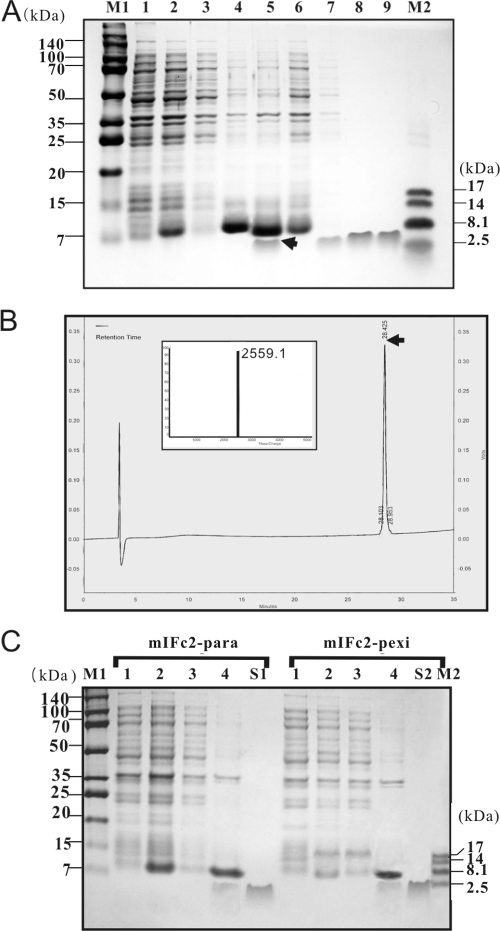
Expression and purification of recombinant AMPs in E. coli BL21(DE3) that harbor pmIFc2-BIIb, pmIFc2-para, or pmIFc2-pexi expression vectors. (A) SDS-PAGE analysis of mIFc2- and BIIb-containing complexes expressed in E. coli by the mIFc2-BIIb vector. Lanes 1 and 2 show total cell protein fraction before and after IPTG induction, respectively. Lane 3 represents the soluble fraction of the total cell proteins shown in lane 2. Lanes 4 and 5 show the insoluble fraction (inclusion bodies) of the total cell proteins shown in lane 2 and the inclusion bodies solubilized in 3 M urea (pH 10), respectively. Lanes 6 and 7 show flowthrough and the bound fraction that passed through Resource 15S cation-exchange chromatography, respectively. Lanes 8 and 9 show the recombinant BIIb purified by reversed-phase HPLC and synthetic BIIb, respectively. IPTG (0.5 mM) was added when the OD600 of the E. coli culture reached 0.6. Lanes M1 and M2 show molecular size markers, with the actual molecular sizes (in kDa) given by the numbers that flank the gel photograph. (B) Purification of the recombinant BIIb by reverse-phase HPLC of the bound fractions from Resource 15S cation-exchange chromatography and determination of purity by MALDI-TOF-MS (inset). The arrow indicates the reversed-phase HPLC fraction that was collected and analyzed by MALDI-TOF-MS. (C) SDS-PAGE analysis of mIFc2- and para- or mIFc2- and pexi-containing complexes expressed in E. coli by the pmIFc2-para (lanes 1 to 4) and pmIFc2-pexi (lanes 1 to 4). Lanes 1 and 2 show total cell proteins before and after IPTG induction, respectively. Lane 3 represents the soluble fraction of the total cell proteins shown in lane 2. Lane 4 shows the insoluble fraction (inclusion bodies) of the total cell proteins fraction shown in lane 2 after it was solubilized in 3 M urea (pH 10). Lanes S1 and S2 show synthetic parasin I and pexiganan, respectively. IPTG (0.5 mM) was added when the OD600 of the E. coli culture reached 0.6. Lanes M1 and M2 show molecular size markers, with the actual molecular sizes (in kDa) given by the numbers that flank the gel photograph.

