FIG. 3.
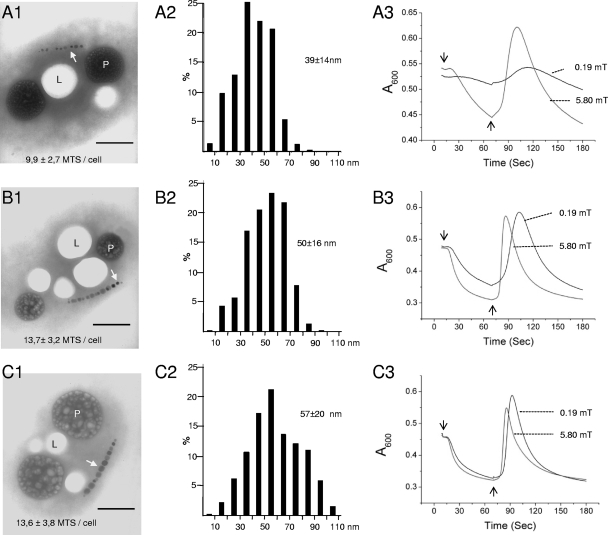
Characterization of MO-1 magnetotaxis by MSP assay. MO-1 cells were incubated in EMS2 medium without the addition of ferric quinate (A) or with 5 μM (B) or 20 μM (C) ferric quinate for 3 days at 24°C. The cells were inspected by TEM, and average numbers of magnetosomes per cell, with standard deviations, were obtained from analyses of 64 (A1), 73 (B1), and 73 (C1) cells. Bars, 0.5 μm. L and P indicate lipid storage granules and phosphorus-rich inclusions, respectively, as previously described (8). White arrows indicate magnetosomes. The size distributions of 426 (A2), 447 (B2), and 462 (C2) magnetosomes are shown as mean sizes with standard deviations. An MSP assay (A3, B3, and C3) was performed with the application of uniform magnetic fields of either 0.19 mT or 5.80 mT perpendicular (downward arrows) or antiperpendicular (upward arrows) to the light beam.

