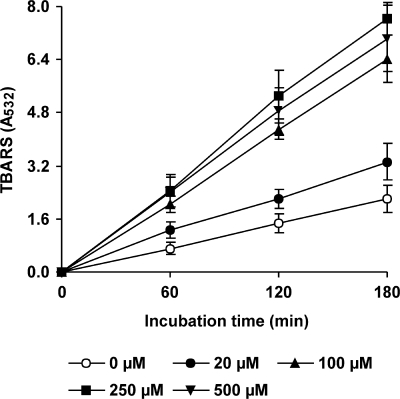
FIG. 4.
Effects of different concentrations of Mn2+ on OH production by P. eryngii via DBQ redox cycling. The incubation mixtures were as described in the legend to Fig. 3 plus 100 μM Fe3+-110 μM EDTA and 2.8 mM 2-deoxyribose. The error bars indicate standard deviations.

