FIG. 1.
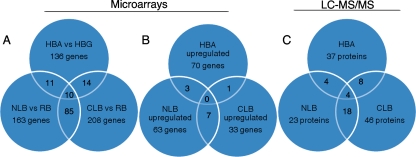
Venn diagrams illustrating the distribution of regulated genes (A and B) and MS-identified proteins (C). (A) Genes with transcript levels that change ≥2-fold in comparisons of nitrogen-limited and nutrient-replete media (NLB versus RB), carbon-limited and nutrient-replete media (CLB versus RB), and cellulose- and glucose-containing media (HBA versus HBG). (B) Genes with transcripts that are upregulated ≥2-fold in these same comparisons. (C) Genes encoding proteins identified by LC-MS/MS in NLB, CLB, and HBA. “Upregulation” is arbitrarily assigned to genes whose transcripts accumulate in NLB relative to RB, in CLB relative to RB, and in HBA relative to HBG. The corresponding “downregulated” genes are not enumerated in this figure but are listed in Table S3 in the supplemental material. In all cases, values within overlapping regions have not been subtracted from totals. For example, peptides corresponding to a total of 37 protein models were identified in HBA medium. Of the 37, 8 were also present in carbon-limited medium, and 4 of these were common to all three media. An additional 61 proteins were identified in Wood's cellulose-containing medium (WBC), and these are listed in Table S3 in the supplemental material.

