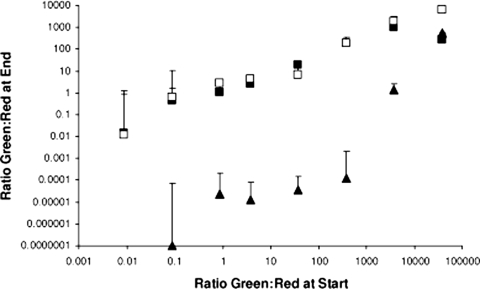
FIG. 7.
Quantification for competition experiments with strains 2R and 3G. The ratio of green cells to red cells at the start of each experiment is plotted against the ratio at the end of the experiment. Open squares, liquid culture; filled squares, TSA with 100 μg/ml PNPG; filled triangles, TSA without PNPG. For TSA without PNPG, no green cells were detectable at the end of the experiment when they were initially present at a ratio of <0.1:1. The error bars indicate the upper limit of the standard deviation of the mean for triplicate assays.

