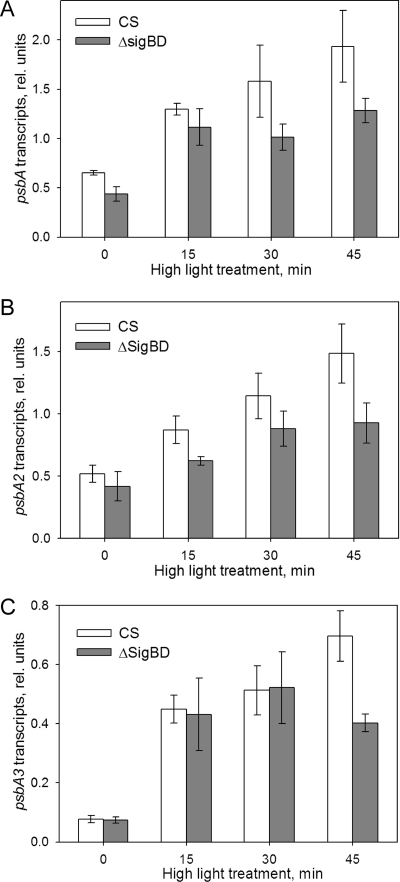
FIG. 8.
Upregulation of the psbA genes in response to high-light irradiation. Quantitative real-time PCR was performed to investigate changes in the amounts of psbA2 and psbA3 transcripts after 0, 15, 30, and 45 min of illumination at a PPFD of 1,500 μmol m−2 s−1. After isolation of total RNA from the samples, 1 μg was used for cDNA synthesis. Reverse transcription-PCR was performed using gene-specific primers. (A) Changes in the size of the total psbA transcript pool in the control and ΔsigBD strains. The size of total psbA transcript pool was calculated by summing the abundances of the psbA2 and psbA3 transcripts. (B and C) Abundance of psbA2 (B) and psbA3 (C) transcripts relative to transcripts of the reference gene (rnpB) in control and ΔsigBD strains. Each column represents the mean of three independent experiments, and the error bars denote the SE.

